
Molecular insights into sex-linked variation using three somatotropic axis genes in different tissues of normal feather Nigerian indigenous chickens
Joseph O Osifeso1* Adewale J Atansuyi2 Ronke S Atansuyi3 Clifford A Chineke4
- Animal Breeding and Genetics Unit, Department of Animal Science, University of Ibadan, Oyo State, Nigeria
- Departamento de Veterinária Medicina, Universidade Federal de Viçosa, Minas Gerais State, Brazil
- Department of Microbiology, Adekunle Ajasin University, Akungba-Akoko, Ondo State, Nigeria
- Department of Animal Production and Health, the Federal University of Technology, Akure, Ondo State, Nigeria
Article Information
- Date Received: 18/09/2025
- Date Revised: 21/12/2025
- Date Accepted: 24/12/2025
- Date Published Online: 28/12/2025
Copyright: © 2025 The Authors. Published by MARCIAS AUSTRALIA, 32 Champion Drive, Rosslea, Queensland, Australia. This is an open access publication under the terms and conditions of the Creative Commons Attribution (CC BY) license (https://creativecommons.org/licenses/by/4.0/).
Citation: Joseph O Osifeso, Adewale J Atansuyi, Ronke S Atansuyi, Clifford A Chineke (2025). Molecular insights into sex-linked variation using three somatotropic axis genes in different tissues of normal feather Nigerian indigenous chickens. Aust J Agric Vet Anim Sci (AJAVAS), 1(2), 100005
https://doi.org/10.64902/ajavas.2025.100005
Abstract
Growth Hormone (GH), Pituitary-specific Transcription factor (PIT), and Insulin-like Growth Factor 1 (IGF-1), are critical regulators of growth and productivity in poultry. This study aimed to compare the sex-specific expression of these three genes in the hypothalamus, liver, and breast muscle of Normal feather indigenous chickens from South-Western Nigeria, a valuable but underutilised genetic resource. Using RT-qPCR techniques, tissue samples were analysed from a cohort of male and female birds at 8 weeks of age. Our findings reveal significant sex-specific differences in gene expression across these tissues. Specifically, GH and PIT expression levels were consistently higher in males, particularly in the breast muscle, while IGF-1 expression was significantly more pronounced in females in the hypothalamus and liver. GH expression in the male hypothalamus was significantly higher than in the female (p < 0.001), and PIT expression in the male breast muscle was also highly significantly higher (p < 0.001). These results indicate that growth-related gene expression in indigenous chickens is shaped by both genetic and sex-linked factors. This study provides foundational molecular insights into the sexual dimorphism of growth in Nigeria’s indigenous chicken breed, suggesting that GH and PIT expression could be explored as targets for improving muscle development in male lines.
Keywords
Hypothalamus, liver, breast muscle, GH, IGF-1, pituitary specific transcription factor
Highlights
- Sex-linked factors significantly influence somatotropic gene expression in Nigerian indigenous chicken breeds.
- GH and PIT expression are consistently higher in males, suggesting potential for selection to improve muscle yield.
- IGF-1 expression is higher in female hypothalamus and liver, indicating sex specific metabolic roles.
1.0 Introduction
The chicken (Gallus gallus domesticus) stands as a pivotal global protein source, with billions of birds contributing to meat and egg production annually (FAO, 2023). Despite this global significance, local chicken breeds in many regions, including Nigeria, often exhibit lower productivity compared to their exotic counterparts, characterised by smaller body sizes and reduced egg yields (Ajayi, 2010). Nevertheless, indigenous chicken populations play a crucial role in rural economies, serving as vital sources of income and nutritional security, particularly in the face of climatic fluctuations (Odubote, 2015). Qualities such as meat flavour and wide consumer acceptance make local chickens especially important in Nigerian diets (Dutse et al., 2024). The Normal feather chicken is a dual-purpose indigenous breed that represents a significant component of the poultry landscape in Nigeria. These indigenous breeds are valuable genetic resources, possessing unique adaptations and genetic variation that risk being lost if not properly studied and conserved (Ladokun et al., 2008). Historically, research efforts have focused on identifying genes influencing growth in commercial exotic breeds, leaving the genetic mechanisms governing growth in indigenous chickens largely underexplored (El-Attrouny et al., 2021). This disparity highlights a critical knowledge gap, particularly concerning the molecular drivers of growth in these locally adapted ecotypes.
Growth and physiological status in poultry are profoundly influenced by sex, with observed differences in growth traits, carcass characteristics, and various physiological parameters between male and female birds (Salim & Zulkifli, 2002, Jaturasitha et al., 2008, Yuan et al., 2024). These sex-linked differences are rooted in differential gene expression, often regulated by sex hormones and the distinct chromosomal composition of birds (ZW in females, ZZ in males) (Gahr, 2004, Kim et al., 2022). The somatotropic axis, comprising Growth Hormone (GH), Insulin-like Growth Factor 1 (IGF-1), and Pituitary-specific Transcription factor (PIT-1), is a major neuroendocrine system regulating growth in chickens (Jia et al., 2018). GH, a potent promoter of growth and differentiation, exerts its effects both directly via GH receptors and indirectly through its mediator, IGF-1 (Lobiezz et al., 2000, Devesa et al., 2016). IGF-1, primarily expressed in the liver, plays a crucial role in poultry growth metabolism, with increased levels correlating with enhanced growth rates (Scanes 2009, Anh et al., 2015). PIT-1, a key transcription factor, is essential for the expression of GH and other growth-controlling genes, indicating a synergistic relationship within this axis (Bodner et al., 1988, Moniem et al., 2023). While the functions of these genes are well-established in commercial breeds, their precise expression profiles and sex-specific variations in indigenous Nigerian chickens remain largely unknown. Atansuyi et al., (2017) found significant variations in growth performance of normal feather chickens in South-Western Nigeria, suggesting potential underlying genetic expression differences. Understanding these molecular differences is essential for developing targeted genetic improvement strategies.
Therefore, this study aimed to investigate the sex-specific expression of GH, PIT-1, and IGF-1 in Normal feather Nigerian indigenous chickens, focusing on the hypothalamus, liver, and breast muscle, to better understand the molecular drivers of growth and sexual dimorphism in this breed. The findings will offer foundational insights for developing targeted genetic improvement strategies to enhance productivity and contribute to sustainable poultry farming practices in the region.
2.0 Materials and methods
2.1 Location: The study was carried out at the Poultry Unit of the Teaching and Research Farm of the Federal University of Technology, Akure, Ondo State, Nigeria. The region experiences a unimodal rainfall pattern from April to October, with an average ambient temperature during the study period ranging from 30–32°C. Further laboratory analyses were conducted at the Molecular Laboratory of the Department of Biochemistry and the Central Research Laboratory at the same institution.
2.2 Experimental design and animal management: Normal feather indigenous chickens were raised intensively on a deep litter system for a period of 56 days (8 weeks). The birds were provided with experimental diets ad libitum throughout the experimental period. The gross composition of the starter mash diet (g/100g) is detailed in Table 1.
| Ingredients | Starter Mash (g/100 g) |
|---|---|
| Maize | 50.00 |
| SBM | 21.00 |
| Wheat offal | 14.90 |
| PKC | 2.00 |
| GNC | 6.60 |
| Fish meal | 1.50 |
| Bone meal | 1.50 |
| Limestone | 1.00 |
| Methionine | 0.40 |
| Lysine | 0.10 |
| Layers premix | 0.50 |
| Salt | 0.50 |
| Total | 100.00 |
Calculated Analysis: Crude protein (%) 20.40
ME = (MJ/kg) 11.20
GNC =Ground nut cake; SBM = soybean meal; ME= Metabolizable energy
The experimental design was a 2x3x3 factorial in a Completely Randomized Design (CRD), with two sexes (male and female) and three tissues (hypothalamus, liver, and breast muscle) and three genes (Growth Hormone (GH), Pituitary-specific Transcription factor (PIT), and Insulin-like Growth Factor 1 (IGF-1)) as the main factors.
2.3 Sample collection: On the 56th day of the experiment, male and female birds were randomly selected from the population and humanely sacrificed by cervical dislocation for tissue sample collection. The specific tissue samples collected included the hypothalamus, liver, and breast muscle. Immediately after collection, these tissue samples were harvested into well-labeled sample test tubes containing RNA later solution. To preserve RNA integrity, the samples were initially stored at 4°C and subsequently transferred to a -80°C deep freezer until further laboratory analyses were performed.
2.4 Gene selection and assay design: Three target genes were selected for comparative expression profiling: Growth Hormone (GH), Pituitary-specific Transcription factor (PIT), and Insulin-like Growth Factor-1 (IGF-1). Beta-Actin (β-ACT) gene was chosen and utilized as the endogenous reference gene, as per established protocols (Leutenegger et al., 1999). Specific primer pairs were meticulously designed to amplify products of approximately 100bp, with an optimal melting temperature of 60°C and a GC content range of 50–60%. To prevent genomic DNA amplification, a predicted exon-exon junction and the reverse primer of each pair were optimized. Annealing temperatures were validated using gradient PCR during the primer design phase. The sequences of the primer pairs used in this study are presented in Table 2.
Table 2. Primer sequences used for qPCR and Real-time qPCR amplification efficiencies
| Gene | Primer Sequences (5′–3′) | Annealing Temp (°C) | RT-qPCR Amplicon Size (bp) | GC (%) |
|---|---|---|---|---|
| GH | F: AGGGATCCAAGCCCTGATGA R: TCCTCAGACCCACCTACGAT |
60.33 – 59.37 | 76 | 55.00 / 55.00 |
| PIT | F: GCGTTTGCTTCATCCGACAA R: AAAGTAGCCTGACCCCTTGC |
59.76 – 59.96 | 327 | 50.00 / 55.00 |
| IGF-1 | F: TTGGCCTGTGTTTGCTTACC R: CAGCAGTAGACGCTTACACCA |
58.96 – 60.07 | 160 | 50.00 / 52.38 |
| β-ACT | F: CATTGTCCACCGCAAATGCT R: AGACGAGATTGGCATGGCTT |
59.75 – 59.76 | 109 | 50.00 / 50.00 |
GC = Guanine-Cytosine percentage, GH = Growth hormone, PIT = Pituitary-specific transcription, IGF-1 = Insulin-like growth factor-1 and β-ACT = Beta-Actin
2.5 Total RNA isolation and cDNA synthesis: Total RNA samples were extracted from the collected chicken tissues, stratified by sex, and subsequently treated with DNase-free reagents. The extraction process involved homogenizing triplicate tissue samples (30mg each) using a Qiagen Tissue Lyzer II, followed by RNA extraction using the TRIzol/chloroform protocol (Life Technologies USA) in accordance with the manufacturer’s instructions. Extracted RNA samples were then DNase treated with DNase I Amplification Grade (InvitrogenTM) prior to reverse transcription and purified using the Qiagen RNeasy Minikit. The quantity, quality, and integrity of the isolated RNA samples were rigorously assessed using a Qubit® 2.0 Fluorometer (Life Technologies USA) and confirmed by gel electrophoresis. RNA purity was considered acceptable with A260/280 ratios between 1.8 and 2.1. Complementary DNA (cDNA) was synthesized from the RNA samples in a 20 µL reaction volume. This was achieved using an Oligo-dT primer and the iScriptTM cDNA Synthesis Kit (Bio-Rad). The integrity of the synthesized cDNA was verified through PCR amplification and 1.5% agarose gel electrophoresis.
2.6 PCR amplification and quantitative real-time qPCR conditions: PCR amplification was performed using specific primer pairs (from Table 2) for each reaction. A final volume of 25 µL reactions was prepared, containing 80–100 ng cDNA, 12.0 µL Taq DNA polymerase master mix, 60 ng of each primer, and 10 µL of nuclease free water. Polymerase chain reactions were carried out in a thermocycler (Step One Plus Applied Biosystem qPCR System) with the following cycling conditions: initial denaturation at 94°C for 3 minutes; 40 cycles of denaturation at 94°C for 30 seconds, annealing at 60°C for 35 seconds, and extension at 72°C for 3 minutes; followed by a final extension at 72°C for 10 minutes. Post-amplification, all samples underwent dissociation curve analysis to confirm the absence of non-specific products and primer dimers.
Quantitative real-time PCR (qPCR) was performed using SYBR® Green detection chemistry. For each gene, samples were run in a 48-well plate on a CFX96 TouchTM Real-Time PCR Detection System (Bio-Rad). Each 10 µL total reaction volume per well contained 5 µL of 2x iQTM SYBR® Green Supermix (Bio-Rad, Hercules, CA, USA), 1 µL of cDNA (0.05 µg of RNA equivalents), 0.5 µL (10 µM) of each gene-specific primer, and 3 µL of DNase-free H2O. Cycling conditions adhered to the manufacturer’s protocol (iQTM SYBR® Green Supermix Kit Bio-Rad, Hercules, CA, USA). The specificity of the amplified fragments was confirmed by running representative PCR products on 1.5% agarose gels, which yielded single, correct-sized bands. These bands were excised from the gel, purified using the QIAquick Gel Extraction Kit (Qiagen), and their concentrations quantified using a NanoDrop spectrophotometer.
For melting curve analysis, a protocol with a temperature gradient from 65°C to 95°C, with increments of 0.5°C for 5 seconds and continuous fluorescent measurements, was employed. The absolute number of target molecules was calculated, and dilution series were generated for each gene, starting from 2.09 x 10⁷ molecules/µL of the purified cDNA target region and diluted down to 0.209 x 10² using 7-fold serial dilutions with nuclease-free water (Sigma), with an initial concentration of 4ng/µL in triplicate. A standard curve was run on the 48-well plate alongside the experimental samples. The relative amount of all mRNAs was calculated using the comparative 2–ΔΔCq method (Livak & Schmittgen 2001). Each experiment included three biological replicates and two technical replicates per biological replicate. Standard curve information (slope, intercept, and R2) was calculated using Bio-Rad CFX Manager Software. A duplicate, no template control (NTC) reaction was included for each primer pair in all qPCR experiments to confirm the absence of exogenous contamination.
2.7 Amount, concentration, and purity (260/280) of total RNA isolated: The amount, concentration, and purity of total RNA in the tissue samples of the 8- week-old chickens were measured as described in the materials and methods. As shown in Table 3, the RNA purity, assessed by the UV spectroscopy Absorbance 260/280 ratio, ranged between 1.9 and 2.1, indicating the correctness of the RNA extraction method and process. The concentration of total mRNA (µg/mL) varied between 95 µg/mL and 420 µg/mL, with the highest concentration observed in the liver of the second male biological replicate and the lowest in the hypothalamus of the female biological replicate. The amount (µg/100µL) ranged between 9 µg/100µL and 42 µg/100µL.
Table 3. Amount, concentration and purity (260/280) of Total RNA isolated from Normal Feathers’ Organs (Breast, Hypothalamus and Liver)
| Sample ID | Abs @ 260 nm | Abs @ 280 nm | 260/280 Ratio | Total RNA Conc. (µg/ml) | Amount (µg/100 µl) |
|---|---|---|---|---|---|
| A1Hypothalamus | 0.053 | 0.025 | 2.1 | 142.25 | 14.25 |
| A1Liver | 0.168 | 0.084 | 2.1 | 418.7 | 41.87 |
| A1Breast | 0.047 | 0.025 | 1.8 | 126.15 | 12.62 |
| A2Hypothalamus | 0.069 | 0.038 | 1.8 | 185.2 | 18.52 |
| A2Liver | 0.069 | 0.039 | 1.8 | 185.2 | 18.52 |
| A2Breast | 0.063 | 0.034 | 1.8 | 169.09 | 16.91 |
| B1Hypothalamus | 0.044 | 0.025 | 1.8 | 118.1 | 11.81 |
| B1Liver | 0.062 | 0.035 | 1.8 | 166.41 | 16.64 |
| B1Breast | 0.05 | 0.028 | 1.8 | 134.2 | 13.42 |
| B2Hypothalamus | 0.036 | 0.020 | 1.8 | 96.62 | 9.66 |
| B2Liver | 0.062 | 0.034 | 1.8 | 166.41 | 16.64 |
| B2Breast | 0.037 | 0.020 | 1.8 | 99.31 | 9.93 |
- A=male, (ii) B=female, (iii) 1= first replicate, (iv) 2= second replicate of the Normal feather chicken at 8 weeks.
2.8 Analytical procedures and statistical analysis: Data generated from the gene expression analysis were used to assess comparative gene expression between chicken sexes.
Statistical analysis was performed using Analysis of Variance (ANOVA) with GraphPad Prism6 (2012) Statistical Package. The statistical model employed is presented below:
Yijkl=μ + Si + Tj + Gk + STij + SGik + TGjk + STGijk +Birdl(Si)+ Ɛijkl
where: Yijkl = Observation of a bird for ith sex in jth tissue and in kth gene (N = 1-4);
µ = General mean for across all sex, tissue, and gene;
Si = Effect of ith sex in the population (i=1-2);
Tj = Effects of jth tissue in the population (j = 1-3);
Gk = Effects of kth gene in the population (k = 1-3);
STij = Interaction of ith and jth terms in population;
SGik = Interaction of jth and kth terms in population;
TGjk = Interaction of ith and kth terms in population;
STGijk = Interaction of ith and jth and kth terms in population;
Birdl(Si) = Random effect of the individual bird (nested within Sex) for biological variation between replicates;
Ɛijkl = Residual effect, which is normally, independently and randomly distributed with zero mean and common variance.
3.0 Results
RNA quality assessment
The quality of the isolated RNA was confirmed by the A260/280 ratio, which ranged between 1.8 and 2.1, indicating high purity suitable for downstream RT-qPCR analysis. The concentration of total mRNA (µg/mL) varied between 95 µg/mL and 420 µg/mL. Detailed RNA quality and concentration data are presented in Table 3.
Effect of Sex on the Expression of Selected Growth Genes in the Hypothalamus
Figure 1 illustrates the expression levels of Growth Hormone (GH), Pituitary-specific Transcription factor (PIT), and Insulin-like Growth Factor-1 (IGF-1) mRNA in the hypothalamus of both male and female Normal feather chickens. A significant sex dependent difference was observed for GH mRNA expression, with males exhibiting a notably higher expression level compared to females (p<0.001). Similarly, PIT mRNA expression in males showed a significant difference (p<0.05) over females in the hypothalamus. Conversely, the female Normal feather chicken demonstrated a significantly higher hypothalamic IGF-1 mRNA expression than the male Normal feather chicken (p<0.001). Among the three genes analyzed in females, IGF-1 exhibited the highest expression level in the hypothalamus. In contrast, the expression levels of the three genes in the male hypothalamus were relatively similar.
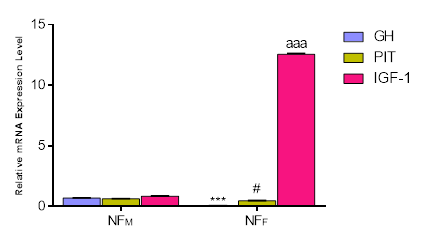
Figure 1. The expressions of growth genes – GH, PIT, and IGF-1 in the hypothalamus of NF chickens. Each bar represents Mean ± Standard Error of Mean in Triplicate (n = 3). ***p < 0.001, as significant difference between NFM: GH and NFF: GH, #p < 0.05 as significant difference between NFM: PIT and NFF: PIT. aaa p<0.001 as significant difference between NFM: IGF-1 and NFF: IGF-1. GH= Growth Hormone, PIT = Pituitary specific Transcription, IGF-1= Insulin-like Growth Factor-1, NF= Normal Feather, M= Male, F= Female
Effect of sex on the expression of selected growth genes in the liver
Figure 2 presents the expression profiles of GH, PIT, and IGF-1 mRNA in the liver of male (cock) and female (hen) Normal feather chickens. No significant difference was observed in the expression of GH in the liver between sexes, indicating similar GH mRNA levels in both males and females at 8 weeks of age. However, a highly significant difference (p<0.001) was found in the expression of PIT mRNA in the liver, with females showing a significantly higher PIT mRNA expression level than males. Furthermore, there was a significant difference (p<0.05) in the expression IGF-1 mRNA in females compared to males. Interestingly, in both sexes, PIT mRNA expression was the highest among the three genes in the liver, while IGF-1 mRNA expression ranked lowest.
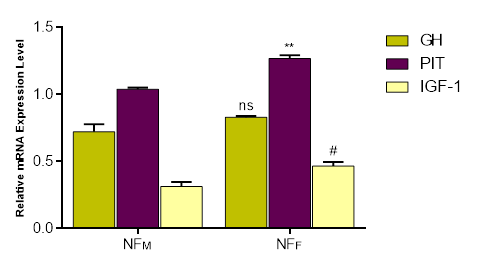
Figure 2. The expressions of growth genes-GH, PIT, and IGF-1 in the Liver of NF Chickens, by RT-qPCR using primers against the cDNA. Each bar represents Mean ± Standard Error of Mean in Triplicate (n = 3). ns indicates no significant difference between NFM: GH and NFF: GH at p < 0.05, **p<0.001 as significant difference between NFM: PIT and NFF: PIT. #p<0.05 as significant difference between NFM: IGF-1 and NFF: IGF-1.GH= Growth Hormone, PIT = Pituitary specific Transcription, IGF-1= Insulin-like Growth Factor-1, NF= Normal Feather, M= Male, F= Female
Effect of sex on the expression of selected growth genes in the breast muscle
Figure 3 depicts the expression levels of GH, PIT, and IGF-1 mRNA in the breast muscle of male and female Normal feather chickens.
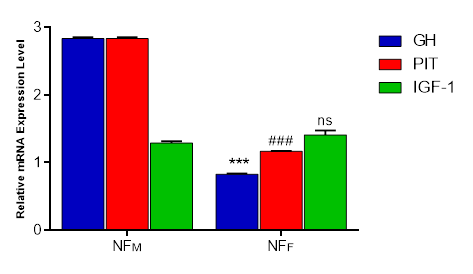
Figure 3. The expressions of growth genes – GH, PIT, and IGF-1 in the breast muscle of NF chickens, Each bar represents Mean ± Standard Error of Mean in triplicates (n = 3). ***p < 0.001, as significant difference between NFM: GH and NFF: GH, p<0.001 as significant difference between NFM: PIT and NFF: PIT. ns indicates no significant difference between NFM: IGF-1 and NFF: IGF-1at p<0.05. GH= Growth Hormone, PIT = Pituitary specific Transcription, IGF-1= Insulin-like Growth Factor-1,NF= Normal Feather, M= Male, F= Female
The GH mRNA expression level in the breast muscle of males was significantly higher than that of females (p < 0.001). Males also displayed a highly significant difference in PIT mRNA expression level compared to female Normal feather chickens in the breast muscle (p < 0.001). In contrast, no significant difference was observed between sexes in the mRNA expression level of IGF-1 in the breast muscle (p > 0.05). Generally, the overall expression level of the different genes in the breast muscle of males was higher than that of females.
Integrative summary of gene expression across tissues: Overall, GH and PIT expression were consistently higher in males, especially in the hypothalamus and breast muscle, whereas IGF-1 expression was predominant in the female hypothalamus and liver. This pattern highlights a clear sexual dimorphism in the somatotropic axis, with males favoring GH and PIT expression in muscle-related tissues, and females showing higher IGF-1 expression in key metabolic and neuroendocrine tissues.
4.0 Discussion
Sex variations in somatotropic gene expression: The endocrine mechanisms governing growth in avian species are complex and exhibit significant sexual dimorphism, a phenomenon influenced by the distinct ZW/ZZ sex chromosome system and hormonal regulation (Gahr, 2004, Decuypere & Buyse, 2005, Bellott et al., 2010, Kim et al., 2022). Our findings reveal significant sex-specific differences in the expression profiles of GH, PIT, and IGF-1 across the hypothalamus, liver, and breast muscle of Normal feather indigenous chicken. The significantly higher expression of GH and PIT in the male hypothalamus and breast muscle suggests a male-biased regulatory drive towards somatic growth and muscle accretion. This aligns with the general observation that male chickens exhibit faster growth rates and larger muscle mass compared to females (Sinpru et al., 2021). PIT-1 is a crucial transcription factor for GH expression (Bodner et al., 1988, Moniem et al., 2023), and the co-localization of high GH and PIT expression in the male breast muscle suggests a synergistic mechanism driving muscle development in this sex. This observation is particularly relevant for indigenous breeds, which are typically slow-growing, as it identifies a potential molecular pathway for selective breeding aimed at improving meat yield in male lines (El-Attrouny et al., 2021). Conversely, the significantly higher expression of IGF-1 in the female hypothalamus and liver, compared to males, suggests a different metabolic and neuroendocrine strategy in females. While the liver is the primary source of circulating IGF-1, the elevated hypothalamic expression in females may indicate a greater role for IGF-1 in the neuroendocrine regulation of reproduction or energy partitioning, which is often prioritized over somatic growth in female poultry.
Insulin-like Growth Factor-1 (IGF-1): Our finding of higher IGF-1 expression in the female hypothalamus compared to the liver, despite the liver being the main site of circulating IGF-1, is noteworthy. This difference is likely sex-dependent, as all birds were subjected to the same diet. The brain, including the hypothalamus, is known to have a high abundance of IGF-1 receptors, suggesting a significant local role for IGF-1 in neuroendocrine function (Armstrong & Hogg 1994). This sex-specific pattern in the hypothalamus may reflect the distinct physiological demands of the female, possibly related to the onset of sexual maturity or egg production, which is regulated by the neuroendocrine axis. The GH and IGF-1 signaling pathways have independent and overlapping functions (Zhou, 2008). In chickens, hepatic IGF-1 mRNA expression is generally GH-dependent post hatching, while extra-hepatic IGF-1 expression is often GH-independent (Tanaka et al., 1996, Devesa et al., 2016). Our results, showing no significant sex difference in liver GH expression but significantly higher female IGF-1 expression in the liver, suggest that in the Normal feather chicken, hepatic IGF-1 regulation may be more complex than a simple GH-dependent mechanism, possibly involving sex hormones or other local factors. This complexity has been noted in other slow-growing indigenous breeds (Jia et al., 2018, Sinpru et al., 2021, El-Attrouny et al., 2021).
Growth Hormone (GH) and Pituitary-specific Transcription Factor (PIT) The strong correlation and co-expression of GH and PIT, particularly in the male breast muscle, reinforce the established role of PIT-1 as a key regulator of GH expression (Bodner et al., 1988, Nelson et al., 1988, Miyai et al., 2005, Moniem et al., 2023). The high expression of GH in the male breast muscle suggests a direct link to the potential for increased muscle growth, a finding consistent with the sexual dimorphism observed in growth traits. The relatively low GH expression in the hypothalamus of both sexes suggests limited GH activity in this neuroendocrine tissue, possibly due to a scarcity of GH receptors or IGF which is typical for the feedback regulation loop of the somatotropic axis. This observation is consistent with previous research indicating that GH mRNA expression in the hypothalamus and breast muscle can exhibit distinct ontogenetic patterns across different sexes (Reiprich et al., 1995, Jia et al., 2018).
The presence of PIT-1 binding sequences within the GH promoter is crucial for GH expression (Nelson et al., 1988). Our research indicates that PIT mRNA was most highly expressed in the breast muscle of males, mirroring the expression level of GH in this tissue. The observation that GH expression levels were consistently slightly lower or similar to PIT mRNA expression levels in all tissues further reinforces this synergistic relationship. The PIT gene is proposed as a strong candidate for growth improvement in Normal feather chickens. Recent studies on other indigenous Nigerian chicken ecotypes have also highlighted the association of PIT-1 gene polymorphisms with growth traits, further supporting its potential as a genetic marker for selection (Ubong et al., 2025).
Study limitations: It is important to acknowledge the limitations of this study. First, the sample size was small (n=4), which, while providing foundational molecular data, limits the statistical power and the generalizability of the findings to the entire Normal feather population. Second, the study focused solely on mRNA expression levels; future research should include validation at the protein level (e.g., Western blot or ELISA) to confirm that transcriptional differences translate into functional protein differences. Third, only three genes were examined in a single indigenous ecotype; a broader transcriptomic or genomic approach across multiple Nigerian ecotypes would provide a more comprehensive understanding of the genetic architecture of growth. Finally, the study did not include functional growth performance data (e.g., body weight, feed conversion ratio) to directly correlate with the observed gene expression profiles.
5.0 Conclusion
This study provides foundational molecular insights into the sexual dimorphism of the somatotropic axis in Normal feather indigenous chickens. We demonstrated significant sex-specific expression profiles for GH, PIT, and IGF-1 across the hypothalamus, liver, and breast muscle. The male-biased expression of GH and PIT in muscle-related tissues suggests a clear molecular basis for the observed sexual dimorphism in growth. The findings are crucial for understanding the molecular mechanisms underlying growth in this valuable indigenous breed. We propose that GH and PIT expression levels could be explored as potential molecular markers for genetic selection aimed at improving muscle yield in male lines. Future research should focus on validating these findings in larger populations, examining the functional correlation between these gene expression differences and actual growth performance data, and conducting protein-level validation to confirm the functional significance of the observed transcriptional changes. Furthermore, a broader genomic approach is warranted to explore the full genetic potential of Nigerian indigenous chicken ecotypes.
Author Contributions: Conceptualisation: Adewale J. Atansuyi, Joseph O. Osifeso; Investigation and Methodology: Joseph O. Osifeso, Adewale J. Atansuyi; Project Administration: Clifford A. Chineke; Validation: Joseph O. Osifeso, Adewale J. Atansuyi, Clifford A. Chineke; Writing – Original draft: Joseph O. Osifeso, Ronke S. Atansuyi; Writing – Review & Editing: Joseph O. Osifeso, Adewale J. Atansuyi, Ronke S. Atansuyi.
Funding: This research received no external funding.
Ethics Approval Statement: All animal experiments were conducted in strict accordance with the ethical guidelines for poultry research established by the National Institute of Animal Science (NIAS20191550). Care was taken to minimise stress and ensure the welfare of the animals throughout the study.
Informed Consent Statement: Not applicable.
Data Availability Statement: All the relevant data that support the findings of this study are available from the corresponding author upon reasonable request.
Acknowledgments: The authors would like to acknowledge the Department of Animal Production and Health, School of Agriculture and Agricultural Technology, Federal University of Technology, Akure, for providing computer resources, library and office space.
Conflicts of Interest: The authors declare no conflicts of interest.
Artificial Intelligence: AI was not used for this original research article.
References
Ajayi FO. 2010. Nigerian indigenous chicken: A valuable genetic resource for meat and egg production. Asian Journal of Poultry Science, 4(4), 164-172. https://doi.org/10.3923/ajpsaj.2010.164.172
Anh, N., Kunhareang, S. & Duangjinda, M. (2015). Association of chicken growth hormones and insulin-like growth factor gene polymorphisms with growth performance and carcass traits in Thai broilers. Asian-Australasian Journal of Animal Sciences. https://doi.org/10.5713/ajas.15.0028
Armstrong DG, Hogg CO. 1994. Type-I insulin like growth factor receptor gene expression in the chick: developmental changes and the effect of selection for increased growth on the amount of receptor mRNA. Journal of Molecular Endocrinology, 12(1), 3-12. https://doi.org/10.1677/jme.0.0120003
Atansuyi, A. J., Lasore, C. O., & Chineke, C. A. (2017). Growth performance characteristics and linear body measurements of four-chicken genotypes raised under intensive management system in South-Western Nigeria. Applied Tropical Agriculture, 22(1), 122-127. https://journals.futa.edu.ng/papers/paper_3_1545126350
Bellott DW, Hughes JF, Skaletsky H, Brown LG, Pyntikova T, Cho TJ, … Page DC. 2010. Convergent evolution of chicken Z and human X chromosomes by expansion and gene acquisition. Nature, 466(7306), 612-616. https://doi.org/10.1038/nature09172
Bodner M, Castrillo JL, Theill LE, Deerinck T, Ellisman M, Karin M. 1988. The pituitary-specific transcription factor GHF-1 is a homeobox containing protein. Cell, 55(3), 505-518. https://doi.org/10.1016/0092-8674(88)90037-2
Decuypere E, Buyse J. 2005. Endocrine control of postnatal growth in poultry. The Journal of Poultry Science, 42(1), 1-13. https://doi.org/10.2141/jpsa.42.1
Devesa, J., Almengló, C. & Devesa, P. (2016). Multiple effects of growth hormone in the body: Is it really the hormone for growth? Clinical Medicine Insights, 9. https://doi.org/10.4137/cmed.s38201
Dutse F, Egwuma H, Dodo EY, Danladi EB, Iliya D. 2024. Assessment of female youth participation in agricultural livelihood generating activities in Gwagwalada area council, Abuja, Nigeria. Journal of Agricultural Economics, Environment and Social Sciences, 10(2), 169-179. http://jaeess.com.ng/index.php/jaeess/article/view/253
El-Attrouny MM, Iraqi MM, Sabike II, Abdelatty AM, Moustafa MM, Badr OA. 2021. Comparative evaluation of growth performance, carcass characteristics and timed series gene expression profile of GH and IGF-1 in two Egyptian indigenous chicken breeds versus Rhode Island Red. Journal of Animal Breeding and Genetics, 138(4), 463-473. https://doi.org/10.1111/jbg.12517
Food and Agriculture Organization of the United Nations. 2023. Poultry Sector. Gateway to poultry production and products. FAO Rome, Italy. https://www.fao.org/poultry-production-products/production/en/
Gahr M. 2004. Hormone-dependent neural plasticity in the juvenile and adult song system of the zebra finch. Annals of the New York Academy of Sciences, 1016(1), 624-647. https://doi.org/10.1196/annals.1298.025
Jaturasitha S, Srikanchai T, Kreuzer M, Wicke M. 2008. Differences in carcass and meat characteristics between chickens indigenous to Northern Thailand (Black-boned and Thai Native) and imported extensive breeds (Bresse and Rhode Island Red). Poultry Science, 87(1), 160-169. https://doi.org/10.3382/ps.2006-00398
Jia J, Ahmed I, Liu L, Liu Y, Xu Z, Duan X, … Li J. 2018. Selection for growth rate and body size have altered the expression profiles of somatotropic axis genes in chickens. PloS ONE, 13(4), e0195378. https://doi.org/10.1371/journal.pone.0195378
Kim H, Choo H, Cha J, Jang M, Son J, Jeong T, … Park JE. 2022. Blood transcriptome comparison between sexes and their function in 4-week Rhode Island red chickens. Animal Cells and Systems, 26(6), 358-368. https://doi.org/10.1080/19768354.2022.2146187
Ladokun AO, Yakubu A, Otite JB, Omeje JN, Sokunbi OA, Onyeji E. 2008. Haematological and serum biochemical indices of Naked Neck and normally feathered Nigerian indigenous chickens in a sub-humid tropical environment. International Journal of Poultry Science, 7(1), 55-58. https://scialert.net/abstract/?doi=ijps.2008.55.58
Leutenegger CM, Mislin CN, Sigrist B, Ehrengruber MU, Hofmann-Lehmann R, Lutz H. 1999. Quantitative real-time PCR for the measurement of feline cytokine mRNA. Veterinary Immunology and Immunopathology, 77(1-2), 129-138. https://doi.org/10.1016/S0165-2427(99)00100-2
Livak KJ, Schmittgen TD. 2001. Analysis of relative gene expression data using real-time quantitative PCR and the 2−ΔΔCT method. Methods, 25(4), 402- 408. https://doi.org/10.1006/meth.2001.1262
Lobiezz PE, Zhu T, Graichen R, Goh EL. 2000. Growth hormone, insulin-like growth factor I and the CNS: Localization, function and mechanism of action. Growth Hormone & IGF Research, 10, S51-S56. https://doi.org/10.1016/S1096-6374(00)80010-6
Miyai S, Yoshimura S, Iwasaki Y, Takekoshi S, Lloyd RV, Osamura RY. 2005. Induction of GH, PRL, and TSHβ mRNA by transfection of Pit-1 in a human pituitary adenoma-derived cell line. Cell and Tissue Research, 322(2), 269-277. https://doi.org/10.1007/s00441-005-0033-z
Moniem, H. A., Yusuf, M., Fathy, A. & Chen, G. (2023). The study of the strength and significance of four biological parameters on the body weight of goose. Environmental Science and Pollution Research International. https://doi.org/10.1007/s11356-023-26109-y
Nelson C, Albert VR, Elsholtz HP, Lu LI, Rosenfeld MG. 1988. Activation of cell-specific expression of rat growth hormone and prolactin genes by a common transcription factor. Science, 239(4846), 1400-1405. https://doi.org/10.1126/science.2831625
Odubote IK. 2015. The local chickens of Nigeria: A Review. Available at: https://www.researchgate.net/publication/277014164_Genetic_diversity_of_the_Nigerian_local_chickens
Reiprich K, Muhlbauer E, Decuypere E. 1995. Characterization of growth hormone gene expression in the pituitary and plasma growth hormone concentrations during post-hatch development in the chicken. Journal of Endocrinology, 145(2), 343-353. https://doi.org/10.1677/joe.0.1450343
Salim HM, Zulkifli I. 2002. Physiological responses of two commercial broiler strains to crate and road transportation. British Poultry Science, 43(3), 433-438. https://doi.org/10.1080/00071669888340
Scanes CG. 2009. Perspectives on the endocrinology of poultry growth and metabolism. General and Comparative Endocrinology, 163(1-2), 24-32. https://doi.org/10.1016/j.ygcen.2009.04.013
Sinpru P, Bunnom R, Poompramun C, Duangjinda M. 2021. Association of growth hormone and insulin-like growth factor I genotype with body weight, dominance of body weight, and mRNA expression in Korat slow-growing chickens. Animal Bioscience, 34(11), 1765. https://doi.org/10.5713/ab.20.0729
Tanaka M, Hayashida Y, Sakaguchi K, Ohkubo T, Wakita M, Hoshino S, Nakashima K. 1996. Growth hormone-independent expression of insulin-like growth factor I messenger ribonucleic acid in extrahepatic tissues of the chicken. Endocrinology, 137(1), 30-34. https://doi.org/10.1210/endo.137.1.8536628
Ubong A, Sunday AA, Endurance LO, De Campos J. 2025. Polymorphism of pituitary specific transcription factor-1 (PIT-1) gene at exon 6 and its association with zoometric traits of FUNAAB Alpha chickens. Acta Scientiarum. Acta Scientiarum, 47, 1-7. https://periodicos.uem.br/ojs/index.php/ActaSciAnimSci/article/view/72347
Yuan, C., Jiang, Y., Wang, Z., Chen, G., Chang, G., & Bai, H. (2024). Effects of sex on growth performance, carcass traits, blood biochemical parameters, and meat quality of Xue Shan chickens. Animals, 14(11), 1556. https://doi.org/10.3390/ani14111556
Zhou J 2008. Effect of dietary conjugated linoleic acid (CLA) on abdominal fat deposition in yellow-feather broiler chickens and its possible mechanism. Asian Australasian Journal of Animal Sciences, 21(12), 1760-1765. https://doi.org/10.5713/ajas.2008.80165
Disclaimer/Publisher’s Note: The statements, opinions, institutional affiliations, data contained in all publications, and all responsibilities for accuracy are solely those of the individual author(s) and contributor(s) and not of MARCIAS AUSTRALIA and AJAVAS/or the Editor(s). MARCIAS AUSTRALIA and AJAVAS/or the Editor(s) disclaim responsibility for any injury to people or property resulting from any ideas, methods, instructions or products referred to in the content.