
An inventory analysis of temporal trends in ruminant greenhouse gas emissions using Tier 1a methodology
Usman M Muhammad1 Aminu Nasiru1 Shehu L Ibrahim1 Makinde O John2 Musa A Rufai2
- Department of Animal Science, Faculty of Agriculture, Bayero University, PMB 3011 Kano, Nigeria
- Department of Animal Science, Faculty of Agriculture, Federal University Gashua, Yobe, Nigeria
Article Information
- Date Received: 01/05/2026
- Date Revised: 15/06/2026
- Date Accepted: 17/06/2026
- Date Published Online: 27/06/2026
Copyright: © 2026 The Authors. Published by MARCIAS AUSTRALIA, 32 Champion Drive, Rosslea, Queensland 4812, Australia. This is an open access publication under the terms and conditions of the Creative Commons Attribution (CC BY) license (https://creativecommons.org/licenses/by/4.0/).
Citation: Muhammad UM, Nasiru A, Ibrahim SL, John MO, Rufai MA (2026). An inventory analysis of temporal trends in ruminant greenhouse gas emissions using Tier 1a methodology. Aust J Agric Vet Anim Sci (AJAVAS), 2(2), 100022. https://doi.org/10.64902/ajavas.2026.100022
Abstract
The objective of the study was to estimate greenhouse gas emissions from ruminants using the Intergovernmental Panel on Climate Change (IPCC) Tier 1a Protocol. Primary data were collected from 360 respondents across livestock producing regions of Nigeria via structured questionnaires, complemented by secondary data from Food and Agricultural Organisation, National Agricultural Extension and Research Liaison Services and National Bureau of Statistics. Primary and secondary data on enteric and manure methane (CH4) and nitrous oxide (N2O) emissions were computed, analysed and validated for reliability following IPCC guidelines. Results showed that between 1998 and 2022, cattle, sheep and goat populations increased by 34, 134 and 135%, respectively. Similarly, total enteric methane and manure emissions increased by 64 and 62%, respectively, corresponding to CO2– equivalent of 65%. It was also evident that N2O from manure also increased by 69%, a CO2-equivalent of 66%. Cattle contributed the largest proportion of emissions, followed by goats and sheep, respectively. Low and high productivity systems accounted for >70 and 30% of total emissions, respectively. A significant increase in ruminant greenhouse gas emissions over the 25-year period with enteric CH4 as the largest emission source was evident. There is the urgent need for targeted interventions like improved feeding strategies, improvements in genetics and manure management through composting, anaerobic digestion and vermicomposting, to mitigate greenhouse gas emissions and optimise nutrient utilisation. Our findings provide critical insights for national climate strategies and sustainable livestock development in Nigeria.
Keywords
Greenhouse gas emission; Tier 1a; methane; nitrous oxide; temporal trends, IPCC guidelines
Highlights
- Small ruminants in low productivity livestock systems account for 70% of greenhouse gas emissions
- The Tier 1a methodology is an advanced analytical model approach in the IPCC framework
- An increase in Nigeria’s ruminant population resulted in an increase in greenhouse gas emissions
1.0 Introduction
Livestock production is a vital component of global agricultural systems, contributing substantially to food security, income generation, employment, and the livelihoods of millions of rural households, particularly in developing countries (Martínez-Ramón et al., 2026). Despite its socio-economic importance, the livestock sector is a significant contributor to anthropogenic greenhouse gas (GHG) emissions. Livestock production systems emit methane (CH₄), and nitrous oxide (N₂O) through enteric fermentation, manure management, feed production, and land-use changes associated with animal agriculture (Nugrahaeningtyas et al., 2025; Manono, 2026). Globally, livestock supply chains account for approximately 14.5% of total anthropogenic greenhouse gas emissions, making the sector one of the major contributors to climate change (Gerber et al., 2013; Grossi et al., 2022). The quantity of emission is influenced by animal species, manure management systems, climatic conditions, and management practices (Kowalska et al., 2025). Cattle are the dominant contributors to livestock-related emissions because of their large population size, greater feed intake, and higher methane production during ruminal fermentation (Grossi et al., 2022).
To derive emissions from livestock, the Intergovernmental Panel on Climate Change (IPCC) Guidelines on National Greenhouse Gas Inventories recommend methods using three tiers of increasing complexity: Tier 1, Tier 1a, Tier 2, and Tier 3 (IPCC, 2019). The Tier 1a methodology represents an advanced Tier 1 approach within the IPCC framework, specifically designed for countries with differentiated production systems. It is particularly relevant for countries where agricultural production systems transition from low productivity subsistence systems to high productivity systems, or where low and high productivity systems coexist. Unlike the default Tier 1 approach that uses uniform emission factors for broad livestock categories, Tier 1a allows inventory compilers to better track transitions and changes in productivity and related emissions over time (IPCC, 2019).
The Tier 1a methodology is particularly relevant for Nigeria because its livestock sector encompasses vastly different production systems, ranging from extensive Fulani pastoralism to intensive commercial dairy operations (Adeyemi and Akinfala, 2021). The Tier 1a approach allows recognition of this diversity through productivity based classification, potentially providing more accurate emission estimates than uniform default factors. The methodology enables tracking of emission changes related to productivity improvements and system transitions, which is critical for monitoring progress toward national climate goals and measuring the effectiveness of development in-terventions. Tier 1a methodologies satisfy international reporting obligations under the United Nations Framework Convention on Climate Change and support Nigeria’s commitments under the Paris Agreement while providing a pathway for gradual improvement toward higher-tier approaches. The primary objective of this study was to estimate greenhouse gasses emission from ruminant animals in Nigeria using IPCC’s Tier 1a Protocol.
2.0 Materials and methods
2.1 Study area
The study conducted in Nigeria, primary data were collected from six major livestock-producing states including; Yobe, Kano, Adamawa, Kogi, Plateau, and Katsina. These states were selected because they represent important ruminant production zones and reflect variation in livestock management practices. The area therefore provided a suitable basis for classifying livestock into category and productivity groups, which the critical steps of assessing emission trends using Tier 1a guidelines.
2.2 Data sources
Two categories of data were used in the study. The first consisted of primary data obtained through structured questionnaires administered to 360 respondents, with 60 respondents selected from each state. The second consisted of secondary data on cattle, sheep, and goat populations from 1998 to 2022, obtained from Food and Agricultural Organization Corporate Statistical Database (FAOSTAT, 2022), the National Bureau of Statistics (NBS, 2022), and the National Agricultural Extension and Research Liaison Services (NAERLS, 2022). These data sources were compared and validated before emission estimation.
2.3 Sampling and distribution
Respondents were selected using purposive and stratified sampling. Purposive sampling ensured the inclusion of livestock farmers, extension officers, industrial expert and other targeted. Stratified sampling was used to capture both low-productivity and high-productivity livestock systems within the study area. The questionnaire collected information on herd composition, production purpose, feeding systems, and manure management practices, which are needed for classification under the Tier 1a framework.
2.4 Validation of livestock population data
To improve reliability, livestock population figures were compared across multiple sources, including FAOSTAT, the National Bureau of Statistics, NAERLS, and other reputable sources. Where differences occurred, the most consistent and complete dataset was retained for analysis. This validation step was necessary because the accuracy of Tier 1a emission estimates depends on dependable population data and proper classification of livestock into productivity system.
2.5 Data analysis
Questionnaire responses dataset was coded and analyzed using Statistical Package for the Social Sciences (SPSS). Descriptive statistics such as frequencies and percentages were used for categorical data. For continuous variables, measures of central tendency (mean, median) and dispersion (standard deviation, range) were used.
2.6 Estimation of emissions
The study followed the 2019 IPCC refinement for estimating methane from enteric fermentation and methane and nitrous oxide from manure management using Tier 1a. Livestock were first grouped by species and production system. Emission factors were then applied to each category, and the resulting emissions were summed to obtain species-level and total emissions. Emission estimates were calculated separately for cattle, sheep, and goats and then aggregated across the study period from 1998 to 2022. Results were presented in tables and figures. Total emissions were then converted to CO₂-equivalent using standard global warming potential values (CH₄ = 28, N₂O = 265).
Calculation of enteric fermentation emissions from livestock
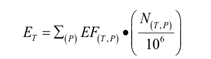
where: ET = methane emissions from Enteric Fermentation in animal category T, Gg CH4 yr-1.
EF(T,P) = emission factor for the defined livestock population T and the productivity system P, in kg CH4 head-1 yr-1.
N(T,P) = the number of head of livestock species / category T in the country classified as productivity system P.
T = species/category of livestock.
P = productivity system, either high or low productivity for use in advanced Tier 1a.
Total Emissions from Livestock Enteric Fermentation
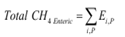
where: Total CH4 Enteric = total methane emissions from Enteric Fermentation, Gg CH4 yr-1 Ei,P = is the emissions for the ith livestock categories and subcategories based on production systems (P), (IPCC, 2019).
Calculation of methane and nitrous oxide from manure management

where:
CH4 (mm) = CH4 emissions from manure management in the country, kg CH4 yr-1
N (T, P) = number of head of livestock species/category T in the country, for productivity system P.
VS (T, P) = annual average VS excretion per head of species/category T, for productivity system P, in kg VS animal-1 yr-1.
AMWS (T, S, P) = fraction of total annual VS for each livestock species/category T that is managed in manure management system S in the country, for productivity system P.
EF (T, S, P) = emission factor for direct CH4 emissions from manure management system S, by animal species/category T, in manure management system S, for productivity system P, g CH4 kg VS-1
S = manure management system
T = species/category of livestock
P = high productivity system or low productivity system for use in advanced Tier 1a. Calculation of N2O from manure management

where:
N2OD (mm) =direct N2O emissions from Manure Management in the country, kg N2O yr-1
N (T, P) = number of head of livestock species/category T in the country, for productivity system P.
Nex (T, P) = annual average N excretion per head of species/category T in the country, for productivity system P, in kg N animal-1 yr-1
Ncdg(S) = annual nitrogen input via co-digestate in the country, kg N yr-1, where the system (s) refers
exclusively to anaerobic digestion
AWMS (T, S, P) = fraction of total annual nitrogen excretion for each livestock species/category T that is managed in manure management system S in the country, dimensionless; to consider productivity class P.
EF3(s) = emission factor for direct N2O emissions from manure management system S in the country, kg N2O-N/kg N in manure management system S
S = manure management system
T = species/category of livestock
P = productivity class, high or low.
44/28 = conversion of N2O-N(mm) emissions to N2O(mm) emissions.
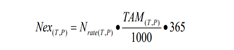
where:
Nex (T, P) = annual N excretion for livestock category T, kg N animal-1 yr-1 (production level P)
Nrate (T, P) = default N excretion rate, kg N (1000 kg animal mass) -1 day-1 for animal category T and production level P.
TAM (T, P) = typical animal mass for livestock category T, kg animal-1
P = productivity class, high or low.
3.0 Results
The data in Table 1 show a steady increase in cattle numbers from 15 million in 1998 to 21 million in 2022. Similarly, sheep increased from 22 million to 50 million, and goats from 38 million to 88 million over the period (Table 1).
Figure 1 shows that cattle contributed the largest share of greenhouse gas emissions. In 1998, cattle emitted 866 Gg of methane from enteric fermentation and 135 Gg of methane plus 15 Gg of nitrous oxide from manure management, increasing by 2022 to 1,200 Gg of methane from enteric fermentation and 187 Gg of methane plus 20 Gg of nitrous oxide from manure management. Over the same period, total CO₂-equivalent emissions from cattle rose from 32 Mt to 44 Mt. Sheep also showed a marked increase in emissions. Enteric methane rose from 125 Gg in 1998 to 292 Gg in 2022, while manure management emissions increased from 21 Gg to 49 Gg of methane and from 1.8 Gg to 4 Gg of nitrous oxide. Corresponding CO₂-equivalent emissions increased from 4.5 Mt to 10.6 Mt over the study period. Goats recorded a similar upward trend. Enteric methane increased from 212 Gg in 1998 to 497 Gg in 2022, while manure management methane and nitrous oxide increased from 23 Gg to 53 Gg and from 5. Gg to 12 Gg, respectively. The CO₂-equivalent emissions of goats rose from 8 Mt to 19 Mt between 1998 and 2022.
Table 1. Distribution of ruminant livestock in Nigeria from 1998 – 2022
| Year | Cattle | Sheep | Goat |
|---|---|---|---|
| 1998 | 15,088,100 | 21,500,000 | 37,500,000 |
| 1999 | 15,103,200 | 24,000,000 | 40,000,000 |
| 2000 | 15,118,300 | 26,000,000 | 42,500,000 |
| 2001 | 15,133,400 | 28,692,600 | 45,260,400 |
| 2002 | 15,148,600 | 29,400,000 | 46,400,000 |
| 2003 | 15,163,700 | 30,086,400 | 47,551,700 |
| 2004 | 15,700,000 | 30,800,000 | 48,700,000 |
| 2005 | 15,875,266 | 31,547,900 | 49,959,000 |
| 2006 | 16,013,382 | 32,305,000 | 51,208,220 |
| 2007 | 16,152,700 | 33,080,400 | 52,488,200 |
| 2008 | 16,293,200 | 33,874,300 | 53,800,400 |
| 2009 | 16,434,978 | 34,687,264 | 55,145,440 |
| 2010 | 16,577,962 | 35,519,760 | 56,524,076 |
| 2011 | 19,041,270 | 38,376,024 | 67,292,536 |
| 2012 | 19,206,928 | 39,335,424 | 68,974,848 |
| 2013 | 19,374,029 | 40,318,809 | 70,699,218 |
| 2014 | 19,753,249 | 41,284,022 | 71,958,213 |
| 2015 | 20,184,763 | 41,632,158 | 72,527,691 |
| 2016 | 19,884,104 | 43,418,947 | 76,135,326 |
| 2017 | 20,057,095 | 44,504,420 | 78,038,709 |
| 2018 | 20,240,605 | 45,609,634 | 79,893,060 |
| 2019 | 20,402,276 | 46,767,182 | 81,875,539 |
| 2020 | 20,585,153 | 47,926,393 | 84,039,154 |
| 2021 | 20,764,244 | 49,124,553 | 86,140,133 |
| 2022 | 20,901,100 | 50,304,116 | 88,070,668 |
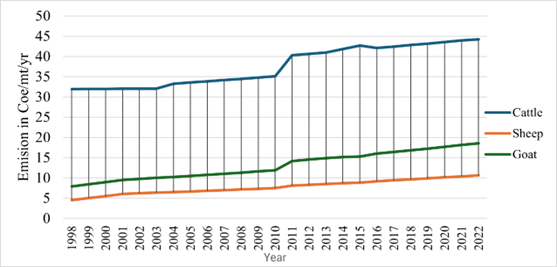
Fig. 1. Estimated greenhouse gas emissions from Nigerian ruminant livestock in CO2-Equivalent.
The combined emissions from all ruminants also increased substantially. Total enteric methane rose from 1,202 Gg in 1998 to 1,988 Gg in 2022, while methane and nitrous oxide from manure management increased from 179 Gg and 22 Gg to 289 Gg and 36 Gg, respectively. In CO₂-equivalent, total emissions increased from 44 Mt to 73 Mt, as shown in Figure 2.
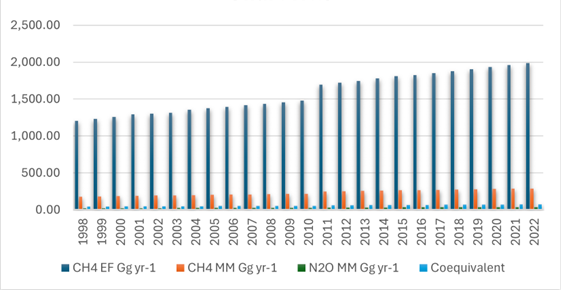
Fig. 2. Estimated total emitted greenhouse gasses of Nigerian ruminant livestock
4.0 Discussion
4.1. Trends in ruminant population growth
The observed increase in cattle, sheep, and goat populations between 1998 and 2022 reflects the growing demand for animal source foods driven by population growth, urbanization, and changing dietary preferences in Nigeria. Livestock ownership also remains an important livelihood strategy among rural households, particularly in northern Nigeria, where cattle, sheep, and goats serve as sources of income, food security, social status, and financial resilience during periods of economic uncertainty. These factors have contributed to the continuous expansion of ruminant populations over the study period. The relatively higher growth rates observed in sheep and goat populations compared with cattle may be attributed to their shorter reproductive cycles, higher reproductive efficiency, lower production costs, and greater adaptability to harsh environmental conditions goat in particular. Small ruminants are generally preferred by poor households because they require lower capital investment and can utilize a wider range of feed resources than cattle. Similar trends have been reported across sub-Saharan Africa, where small ruminant populations have expanded more rapidly than cattle populations due to their adaptability and economic importance to smallholder farming systems (Svinurai and Wilkes, 2026). The continued increase in livestock populations has important implications for greenhouse gas emissions because larger animal populations inevitably increase feed consumption, enteric fermentation, manure production, and overall emission. Consequently, population growth remains one of the principal drivers of livestock-related greenhouse gas emissions globally and in developing countries where productivity gains have not always kept pace with herd expansion (Fischer and Herrero, 2026).
4.2 Enteric methane emission trends
The substantial increase in enteric methane emissions observed during the study period is consistent with the growth in ruminant populations and the predominance of extensive production systems in Nigeria. Enteric methane is generated as a natural by-product of microbial fermentation in the rumen, where methanogenic microorganisms utilize hydrogen produced during feed digestion to form methane. Consequently, increases in animal numbers directly translate into higher methane emissions when management and feeding practices remain largely unchanged. Another important factor contributing to elevated methane emissions is the reliance on low-quality fibrous feeds and natural grazing resources, which dominate many ruminant production systems in Nigeria. Diets with high fiber content generally promote greater methane production because they favor fermentation pathways that generate larger quantities of hydrogen within the rumen. Improved feeding strategies, including higher-quality forages and balanced supplementation, have been shown to reduce methane emissions per unit of animal product by improving feed conversion efficiency and animal productivity (Roques et al., 2024). The findings agree with recent studies reporting that enteric fermentation remains the largest source of greenhouse gas emissions from livestock systems worldwide. Similar increases in enteric methane emissions have been reported in African and Mediterranean livestock systems where population growth and extensive production systems remain dominant drivers of emissions (Chebli et al., 2026; Svinurai & Wilkes, 2026).
4.3 Methane emissions from manure management
Methane emissions from manure management increased considerably throughout the study period, largely reflecting the increase in livestock populations and the corresponding rise in manure production. As animal numbers increase, greater quantities of manure are generated and become potential sources of methane emissions during storage, accumulation, and decomposition. The magnitude of methane emissions from manure is strongly influenced by manure handling practices, storage conditions, temperature, and moisture content. In many traditional livestock systems, manure is often deposited directly on grazing lands or accumulated under conditions that facilitate anaerobic decomposition, thereby increasing methane production. Although manure-related methane emissions were lower than emissions from enteric fermentation, they nevertheless represent an important component of the overall greenhouse gas inventory and should not be overlooked in mitigation planning. Recent studies have highlighted the potential of improved manure management practices such as composting, anaerobic digestion, manure drying, and biogas production to reduce methane emissions while simultaneously improving nutrient recycling and energy recovery (Kowalska et al., 2025).
4.4 Nitrous oxide emissions from manure management
The increase in nitrous oxide emissions observed in this study was primarily associated with increased manure production resulting from growing livestock populations. Nitrous oxide is produced through microbial nitrification and denitrification processes that occur when nitrogen contained in animal excreta is transformed under suitable environmental conditions. Consequently, larger livestock populations increase nitrogen excretion rates and subsequently increase the potential for nitrous oxide emissions. The relatively high global warming potential of nitrous oxide makes it a particularly important greenhouse gas despite being emitted in smaller quantities than methane. Effective manure management strategies that improve nitrogen utilization and reduce nitrogen losses can therefore contribute significantly to climate change mitigation within livestock production systems. Similar relationships between livestock population growth and nitrous oxide emissions have been reported in recent greenhouse gas inventory studies conducted in both developed and developing countries (Nugrahaeningtyas et al., 2025; Chebli et al., 2026).
4.5 Contributions of cattle, sheep and goats to greenhouse gas emissions
Cattle contributed the largest proportion of total greenhouse gas emissions. This finding is expected because cattle possess greater body weights, consume larger quantities of feed, produce more manure, and exhibit higher methane emission factors than sheep and goats. The larger rumen capacity of cattle also supports greater microbial fermentation activity, resulting in higher methane production per animal. Although sheep and goats contributed smaller proportions of total emissions, their rapidly growing populations indicate that their contribution to national greenhouse gas emissions may continue to increase in the future. The findings are consistent with global livestock emission inventories, which consistently identify cattle as the dominant source of livestock-related greenhouse gas emissions because of their biological characteristics and population size (Fischer & Herrero, 2026; Manono, 2026). Low-productivity systems accounted for the majority of greenhouse gas emissions from Nigerian ruminants. This finding reflects the dominance of extensive production systems characterized by low-quality feed resources, limited supplementation, lower animal performance, and poor feed conversion efficiency. Under such conditions, animals require longer periods to reach market weight or achieve productive performance, resulting in higher greenhouse gas emissions per unit of output.
Conversely, high-productivity systems contributed a smaller proportion of emissions because improved feeding practices, better genetics, and enhanced management increase production efficiency and reduce emission intensity. While total emissions may still occur in high-productivity systems, the amount of greenhouse gas emitted per unit of milk or meat produced is generally lower than in low-productivity systems. Similar observations have been reported in recent studies emphasizing the importance of productivity improvement as a key strategy for reducing livestock emission intensity while maintaining food production (Fischer and Herrero, 2026; Svinurai and Wilkes, 2026). A key implication of these findings is that climate mitigation in the livestock sector should focus on improving productivity rather than simply reducing herd numbers. The Tier 1a approach is particularly useful because it distinguishes between low- and high-productivity systems and can therefore better represent emission trends in heterogeneous production environments such as Nigeria. This makes tier 1a more informative than a default Tier 1 factor when livestock systems vary widely in feeding, breeding, and management intensity (IPCC, 2019).
5.0 Limitations of the study
This study relied on Tier 1a default emission factors, which improves estimation relative to a simple Tier 1 approach but still does not fully capture local variation in diet composition, animal performance, and management intensity. The estimation also depended on secondary livestock population datasets and survey-based classification of category and production systems, which may introduce uncertainty where records were incomplete or where management practices changed over time. Despite these limitations, the study provides a valuable baseline for understanding long-term ruminant emission trends in Nigeria.
6.0 Conclusion
The study shows that greenhouse gas emissions from ruminant livestock in Nigeria increased substantially between 1998 and 2022. Cattle contributed the largest share of emissions, followed by goats and sheep, while enteric fermentation remained the dominant emission source. The results indicate that population growth, low feed quality, and extensive management systems were the main drivers of the observed trends. The Tier 1a approach provided a useful framework for capturing differences between low and high productivity systems and offers a practical basis for improving national livestock emission estimates.
7.0 Recommendations
The following recommendations were made; awareness and training to farmers through extension services on climate-smart livestock practices, including efficient grazing systems, feed supplementation, and manure recycling, to reduce emissions and accelerate animal growth. Development and maintenance of a robust national livestock data system to support future GHG inventory upgrades to Tier 2 or 3 methodologies. Facilitate construction of composting units, biogas digesters, and stabilization ponds to lower CH₄ and N₂O emissions while producing renewable energy or biofertilizer. Integrate livestock emission inventories into Nigeria’s Nationally Determined Contributions (NDCs) to ensure alignment with global climate targets and access to international support mechanisms.
Author Contributions:
Conceptualisation: Usman M Muhammad, Aminu Nasiru, Shehu L Ibrahim, Makinde O John, Musa A Rufai; Methodology: Usman M Muhammad, Aminu Nasiru, Shehu L Ibrahim, Makinde O John, Musa A Rufai; Literature search and data collection: Usman M Muhammad, Aminu Nasiru, Shehu L Ibrahim, Makinde O John, Musa A Rufai; Study selection and data curation: Usman M Muhammad, Aminu Nasiru, Shehu L Ibrahim, Makinde O John, Musa A Rufai; Formal analysis and synthesis of results: Usman M Muhammad, Aminu Nasiru, Shehu L Ibrahim, Makinde O John, Musa A Rufai; Writing – Original draft preparation: Usman M Muhammad; Writing – Review and editing: Usman M Muhammad, Aminu Nasiru, Shehu L Ibrahim, Makinde O John, Musa A Rufai; Supervision: Aminu Nasiru, Shehu L Ibrahim, Makinde O John, Musa A Rufai. All authors have read and agreed to the published version of the manuscript.
Funding: This review received no external funding.
Ethics Approval Statement: Not applicable. This study is based on data not involving direct experimentation with animals.
Informed Consent Statement: Informed consent was obtained from all subjects involved in the study.
Data Availability Statement: The data for this study are available from the corresponding author upon reasonable request.
Acknowledgments: The authors express their gratitude to the researchers and institutions whose published studies contributed to this study.
Conflicts of Interest: The authors declare no conflicts of interest.
Artificial Intelligence: AI was not used in this manuscript.
References
Alba Adeyemi MA, Akinfala EO. 2021. Greenhouse gas emissions from livestock and mitigation options in Nigeria. Nigerian Journal of Animal Production, 48(5), 328–342. https://doi.org/10.51791/njap.v48i5.3219
Chebli, Y, El Otmani S, Wassie SE, Chentouf M. 2026. Estimation of greenhouse gas emissions trends from the livestock sector in Morocco. Frontiers in Environmental Science, 14, 1823034. https://doi.org/10.3389/fenvs.2026.1823034
Food and Agricultural Organisation 2022. FAOSTAT World Food and Agriculture – Statistical Yearbook 2022. Rome. ISSN 2225-7373. https://doi.org/10.4060/cc2211en retrieved on 09/Jul/2025.
Fischer CG, Herrero M. 2026. Reduction in cattle numbers can unlock greenhouse gas mitigation potential without compromising milk and meat production. Global Food Security, 48, 100906. https://doi.org/10.1016/j.gfs.2026.100906
Gerber PJ, Steinfeld H, Henderson B, Mottet A, Opio C, Dijkman J, Falcucci A, Tempio G. 2013. Tackling climate change through livestock: A global assessment of emissions and mitigation opportunities. Food and Agriculture Organization of the United Nations. http://www.fao.org/3/i3437e/i3437e.pdf
Grossi G, Goglio P, Vitali A, Williams AG. 2022. Climate change and livestock production: A literature review. Atmosphere, 13(1), 140. https://doi.org/10.3390/atmos13010140
Intergovernmental Panel on Climate Change 2019. 2019 Refinement to the 2006 IPCC Guidelines for National Greenhouse Gas Inventories. Volume 4. Agriculture, forestry and other land uses. Geneva, Switzerland. https://www.ipcc-nggip.iges.or.jp/public/2019rf/ retrieved on 06/May/2024.
Kowalska J, Mazur K, Gawęda D. 2025. Manure management as a potential mitigation tool to eliminate greenhouse gas emissions in livestock systems. Sustainability, 17(2), 586. https://doi.org/10.3390/su17020586
Manono BO. 2026. Methane emissions from livestock operations: Sources, sinks, and mitigation strategies. Methane, 5(1), 7. https://doi.org/10.3390/methane5010007
Martínez-Ramón V, López-Ridaura S, Cossu A. 2026. Systems-oriented innovation towards sustainable smallholder mixed farming. npj Sustainable Agriculture, 4, 5. https://doi.org/10.1038/s44264-025-00114-9
National Agricultural Extension and Research Liaison Services 2022. Agricultural performance survey report: livestock in Nigeria. NAERLS, Ahmadu Bello University, Zaria, Nigeria. https://naerls.gov.ng
National Bureau of Statistics 2022. Agricultural Statistics Report: livestock population data. NBS, Abuja, Nigeria. https://www.nigerianstat.gov.ng
Nugrahaeningtyas E, Lee JS, Lee DJ, Kim JK, Park KH. 2025. Impacts of guidelines transition on greenhouse gas inventory in the livestock sector: A study case of Korea. Journal of Animal Science and Technology, 67(2), 453–467. https://doi.org/10.5187/jast.2024.e7
Roques S, Martinez-Fernandez G, Ramayo-Caldas Y, Popova M, Denman SE, Meale SJ, Morgavi DP. 2024. Recent advances in enteric methane mitigation and the long road to sustainable ruminant production. Annual Review of Animal Biosciences, 12, 317–342. https://doi.org/10.1146/annurev-animal-021022-024931
Svinurai WS, Wilkes A. 2026. Recent progress in greenhouse gas inventory improvement for cattle emissions in Africa highlights priorities for further research. Frontiers in Animal Science, 7, 1811608. https://doi.org/10.3389/fanim.2026.1811608
Disclaimer/Publisher’s Note: The statements, opinions, institutional affiliations, data contained in all publications, and all responsibilities for accuracy are solely those of the individual author(s) and contributor(s) and not of MARCIAS AUSTRALIA and AJAVAS/or the Editor(s). MARCIAS AUSTRALIA and AJAVAS/or the Editor(s) disclaim responsibility for any injury to people or property resulting from any ideas, methods, instructions or products referred to in the content.